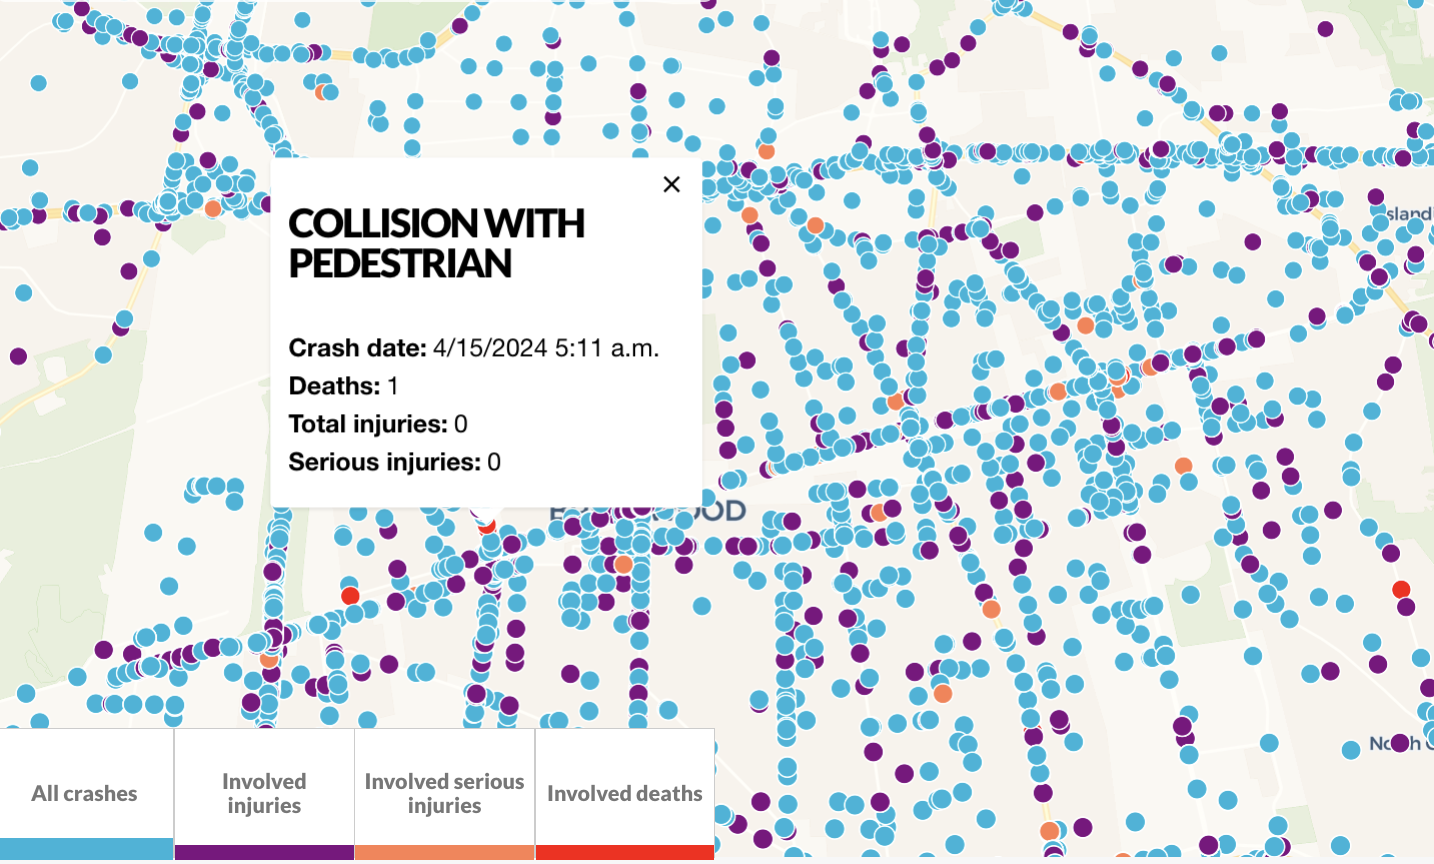
Locating Long Island's most dangerous roads
Newsday
Built an interactive map identifying the most dangerous roads on Long Island, color-coded to indicate fatalities and serious injuries. The map was built as part of Newsday’s year-long Dangerous Roads series. This map was the among the top stories of the year in user metrics.